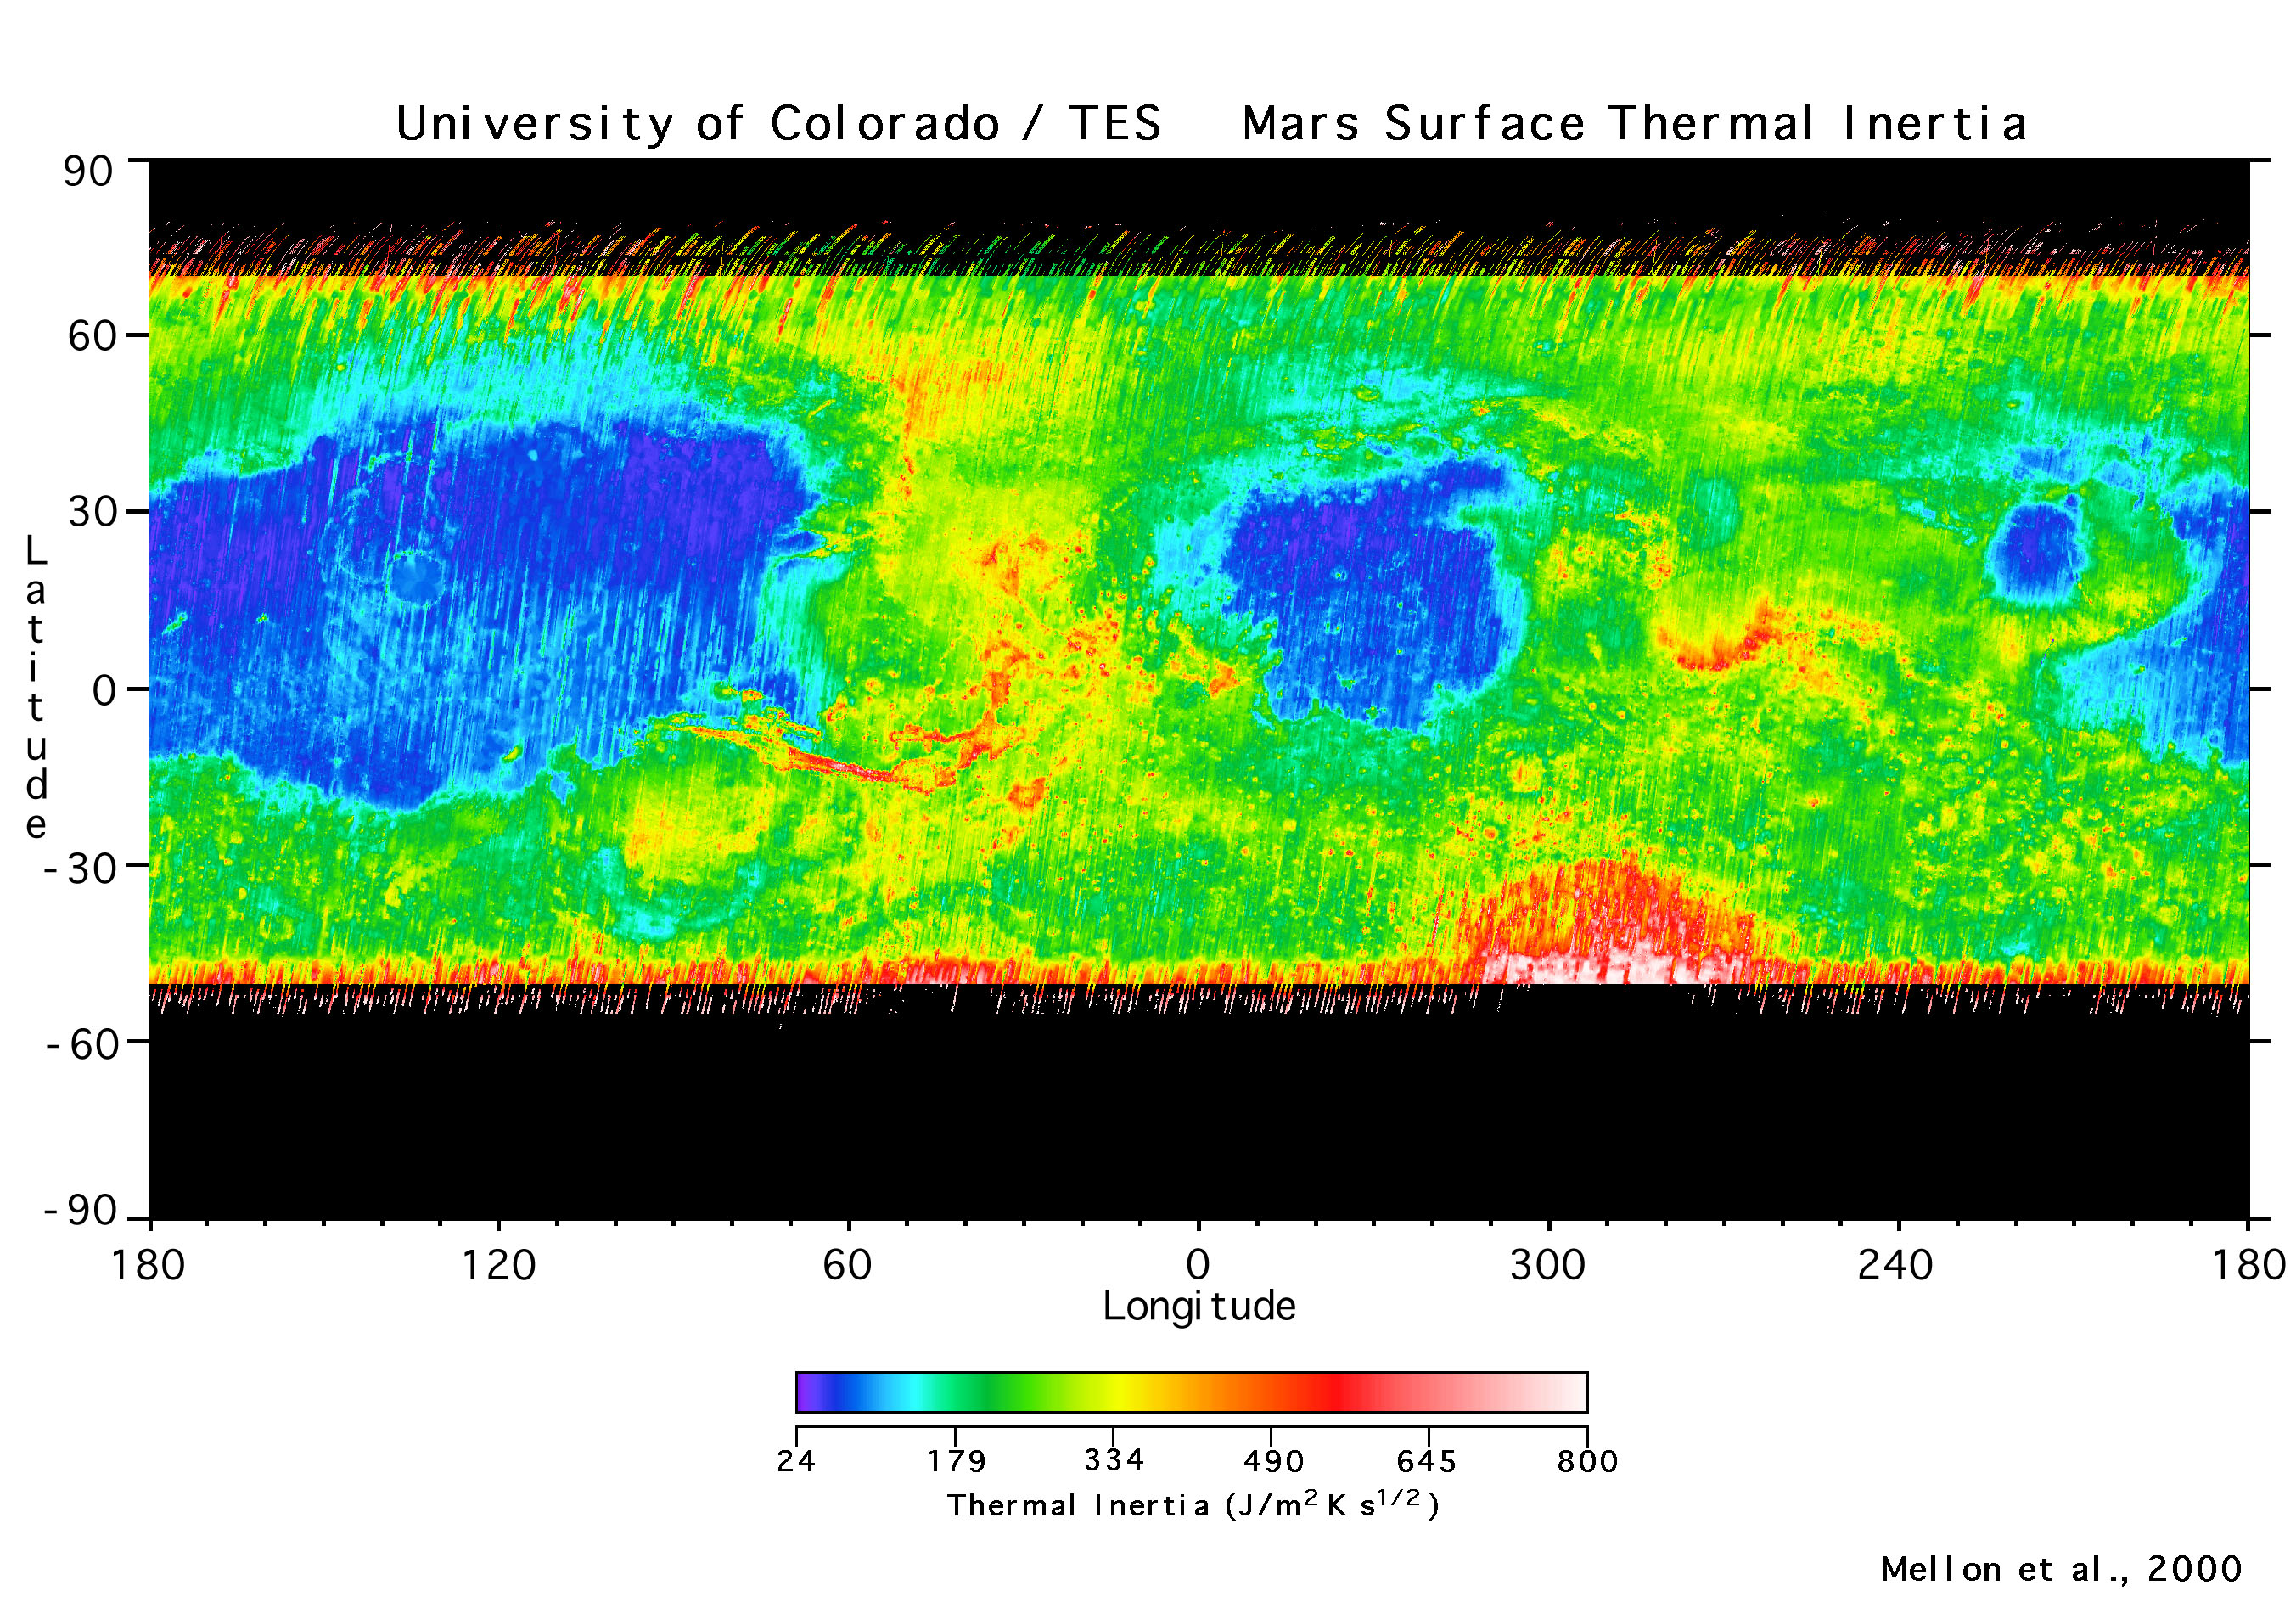
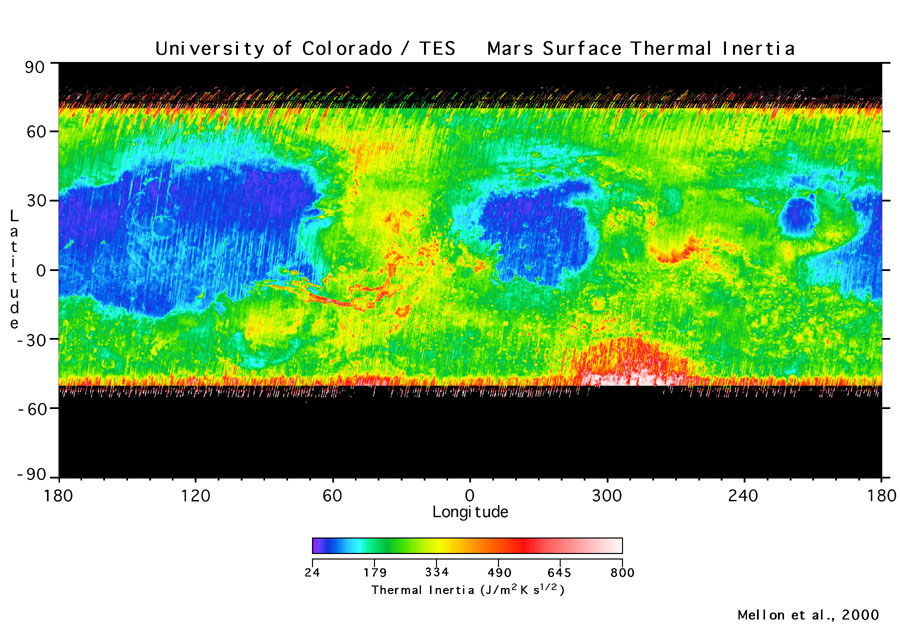
This site contains a downloadable thermal inertia map derived from Mars Global Surveyor Thermal Emission Spectrometer observations of the surface temperatures of Mars during the early portion of the primary mapping mission. See note below for proper referencing.
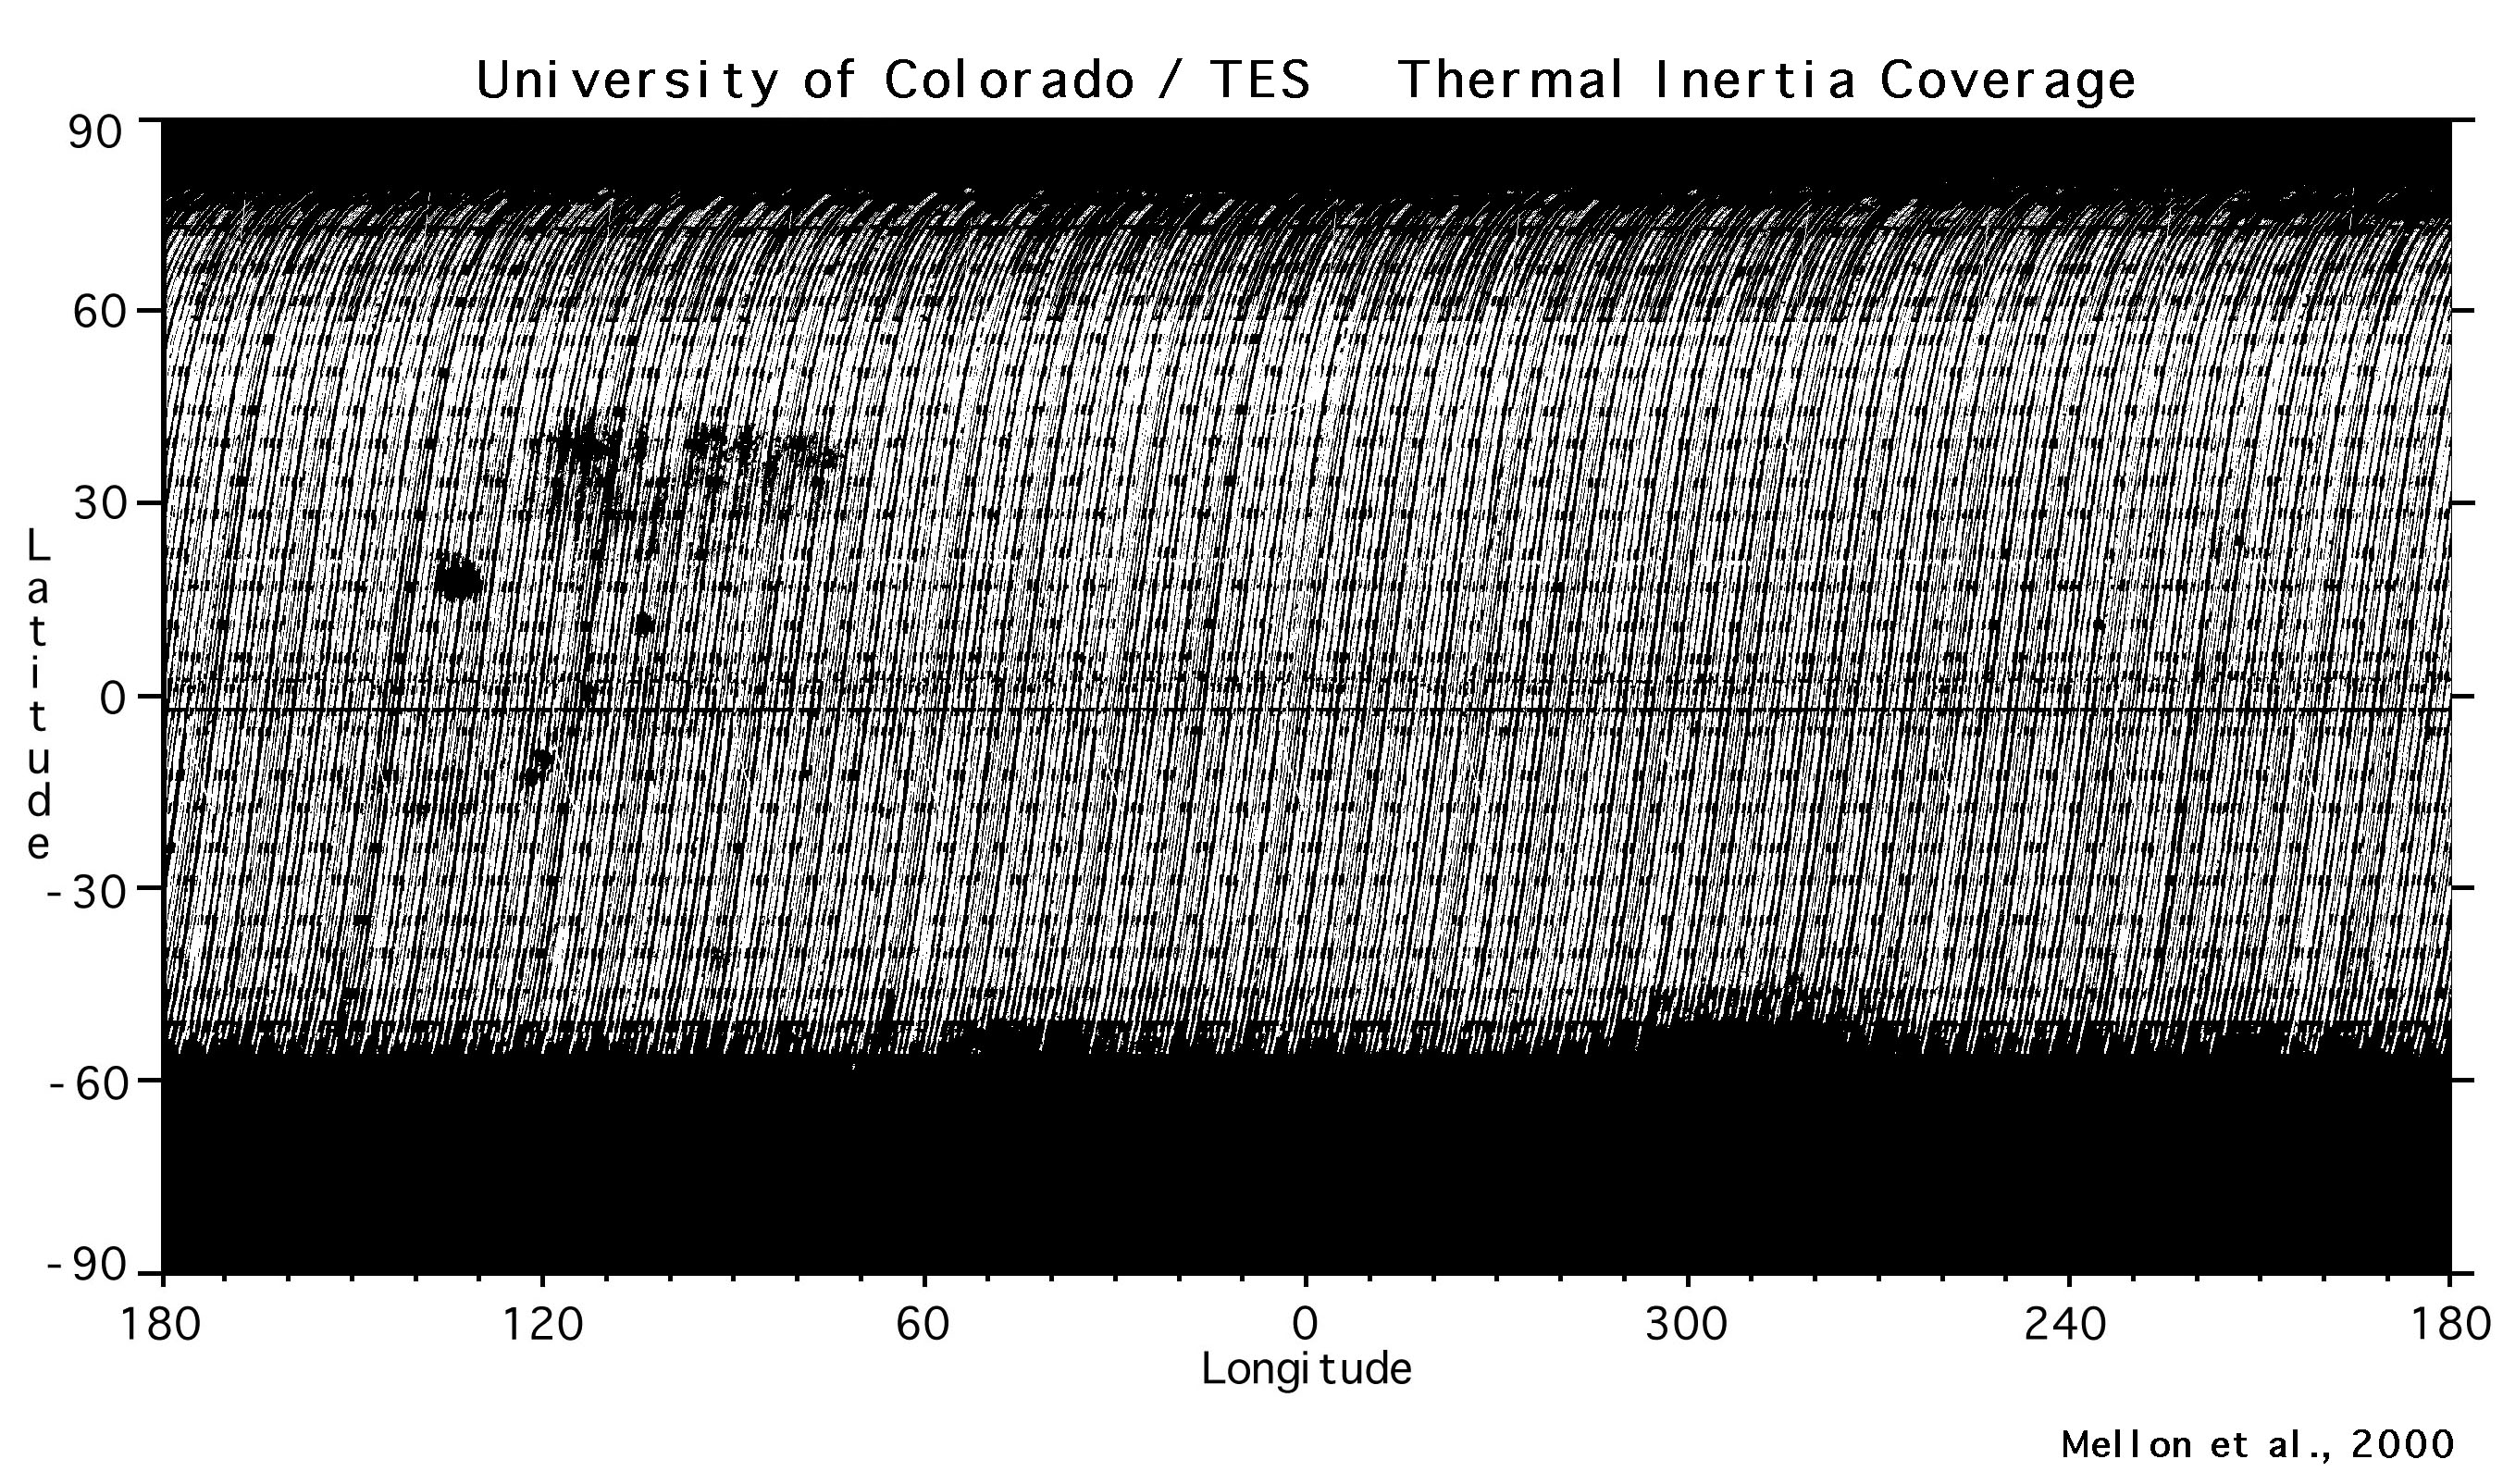
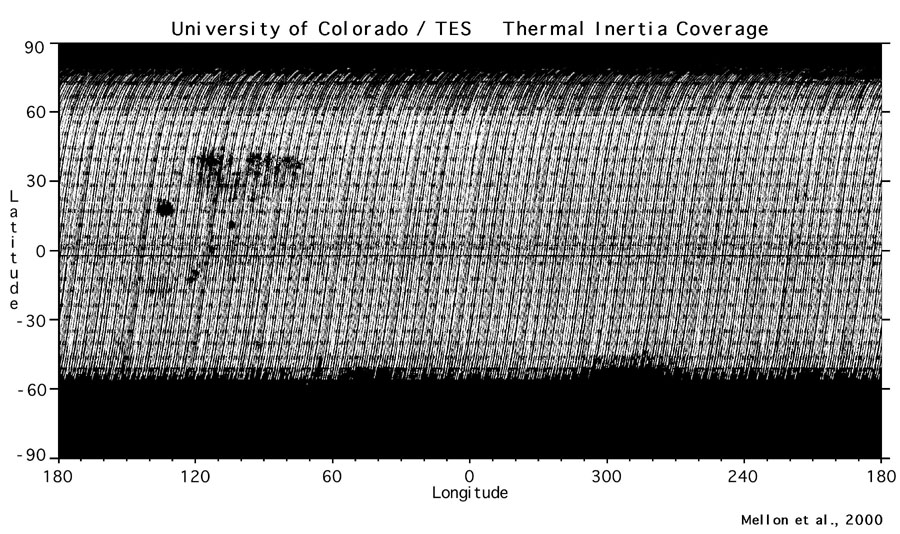
There are two maps: 1) thermal inertia map at 8 pixel-per-degree resolution, and 2) a correlated interpolation mask. The thermal inertia map is derived from TES thermal bolometer, nighttime temperature observations. Between 50 degrees south and 70 degrees north the map has been filled by interpolation. The interpolation mask identifies these interpolated pixels, in the event they are not wanted for your application. (ie: The thermal inertia map multiplied by the interpolation mask gives an uninterpolated map. The mask also provides a map of real data coverage.)
BINARY FILE THERMAL INERTIA (8 MB) INTERPOLATION MASK (4 MB) JPG MAP IMAGE - LARGE THERMAL INERTIA (1.4 MB) INTERPOLATION MASK (1.7 MB) JPG MAP IMAGE- SMALL THERMAL INERTIA (211 KB) INTERPOLATION MASK (109 KB) In addition, here is the color table that's being used for published thermal inertia maps.
THERMAL INERTIA COLOR TABLE IN PPM FORMAT (4KB) THERMAL INERTIA COLOR TABLE IN IDL FORMAT (36KB) Specifications:
- 8 pixel per degree resolution
- derived range is 24 to 800 in SI units (J m-2 K-1 s-½), higher and lower values are not computed
- includes data from orbits 1583-3814 from Mars Orbit Insertion (beginning of the mapping mission)
- uses only nighttime data with surface temperatures above 160 K.
- binary file format
- inertia: 2880 x 1440 two-byte integer format (25 to 799, multiplier=1, offset=0)
ASCII header 5760 bytes long
created on a SUN Ultra 30 running Solaris for those concerned with byte swapping- mask: 2880 x 1440 byte format (1 = TES data, 0 = no data or interpolated fill)
ASCII header 2880 bytes long
Example: If you are using IDL, you can read the thermal inertia file via
IDL> OPENR,1,'nightmap.bin'
IDL> A = ASSOC(1,INTARR(2880,1440),5760)
IDL> MAP = A[0]
If you are running on a platform which is byte-swapped relative to Sun (e.g., Intel-based PC or Mac):
IDL> BYTEORDER, MAP
The following IDL code can be used to display the map:
IDL CODE FOR THERMAL INERTIA MAP DISPLAY (12KB) Run with either IDL command:
IDL> ti_mapplot, /m2000
IDL> ti_mapplot, /m2000, /mask
All use of this map should carry the following reference:
Mellon, M. T., B. M. Jakosky, H. H. Kieffer, P. R. Christensen, High-Resolution thermal inertia mapping from the Mars Global Surveyor Thermal Emission Spectrometer, Icarus, 148, 437-455, 2000.
Point of Contact:
Michael T. Mellon
Cornell University
422 Space Science Building
Ithaca, NY 14853
Email: Michael.Mellon@Cornell.edu
tel: 607-255-1957